Are you looking for new ways to analyze, improve, or automate your business processes?
Maybe you want to reduce costs or increase the quality and efficiency of a process.
Or you might be simply looking for a way to share your implicit process knowledge with the rest of your team.
Either way, business process modeling is what you need.
Business process modeling is the act of visually representing your processes with the intention to improve them.
Depending on the business objectives that you are trying to achieve, you can use different business process modeling techniques.
The techniques we’re going to cover include:
- Business Process Modeling Notation (BPMN)
- Unified Modeling Language (UML)
- Flowchart Technique
- Data Flow Diagrams (DFD)
- Gantt Charts
- Workflow Technique
- Integrated Definition for Functioning Model (IDEF)
- Colored Petri Nets (CPN)
- Role-Activity Diagrams (RAD)
- Role-Interaction Diagrams (RID)
- Object-Oriented Methods
- Simulation Model
Let’s get started!
11+ Best Business Process Modeling Techniques
Every business is different and there is no out-of-the-box solution that will work for all. So, you should pick a technique depending on:
- What is your end goal? Do you want to remove redundant steps, improve the process’ efficiency or cut costs? ?
- Which business process do you want to focus on?
- What issue do you want to target? Is it related to your internal communication, the technicalities of the process, or the overall workflow itself?
Having said that, we will move on to reviewing some of the best techniques out there…
Business Process Modeling Notation (BPMN)
The Business Process Modeling Notation is a flow chart technique which helps you to visually illustrate a process.
The only difference from an actual flowchart is that you have to use a set of standardized symbols instead of coming up with your own notation.
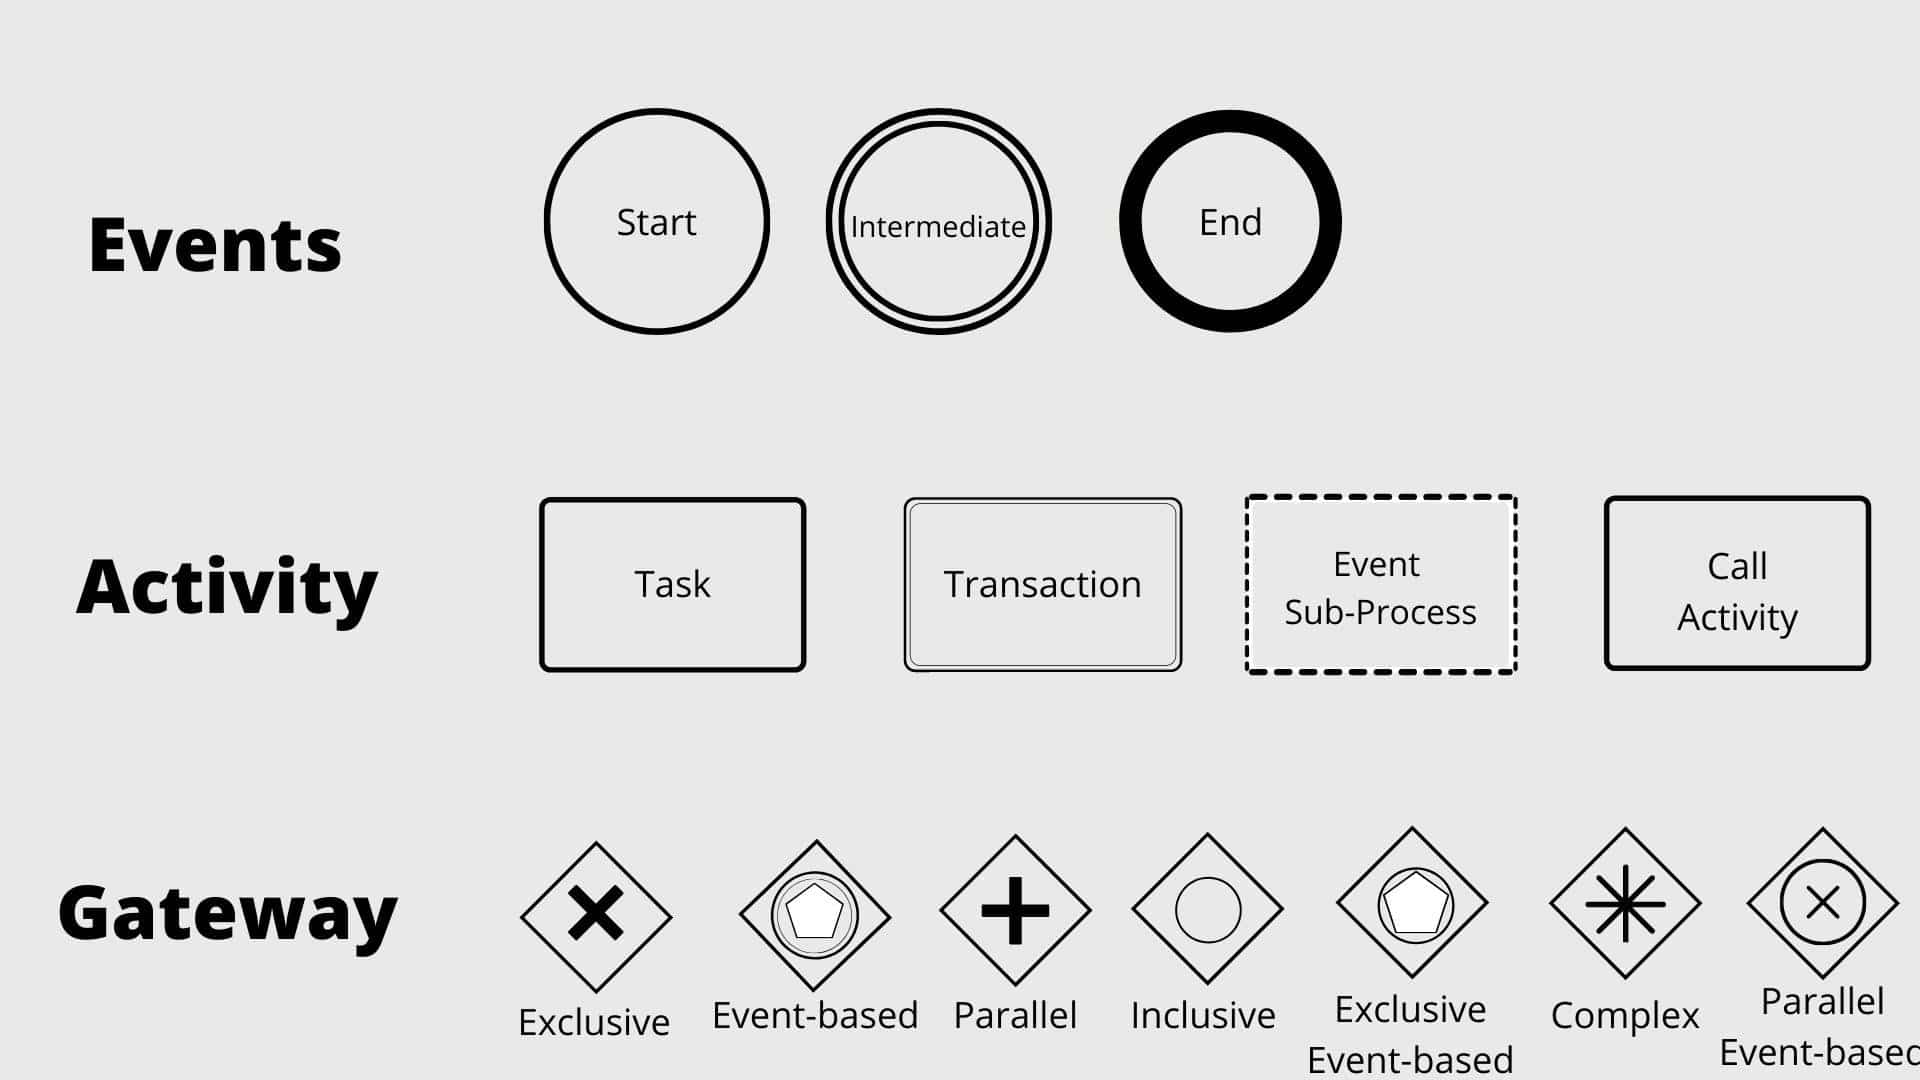
The 4 main BPMN objects that you need to know are:
Flow objects
- events (circles)
- gateways (diamonds)
- activities (rectangles with rounded corners)
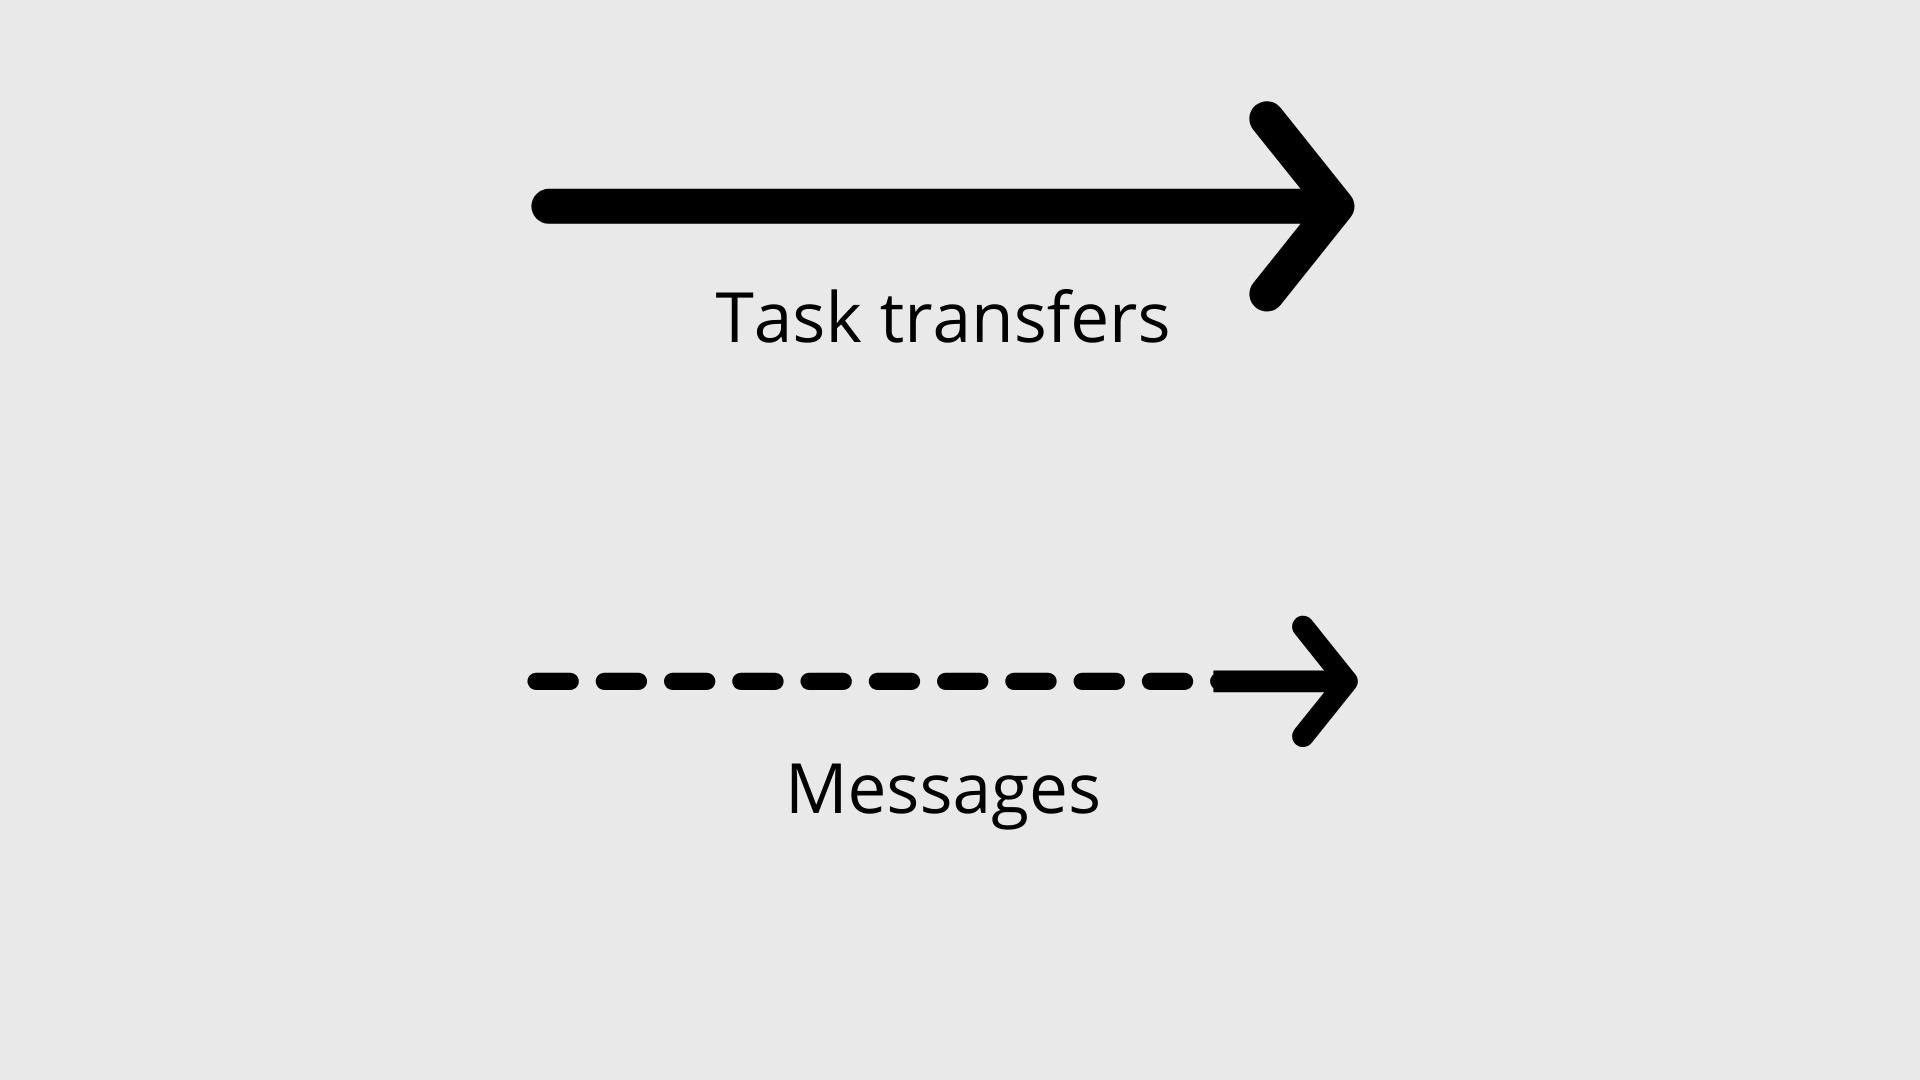
Connecting objects
- task transfers (solid arrows)
- messages (dashed arrows)
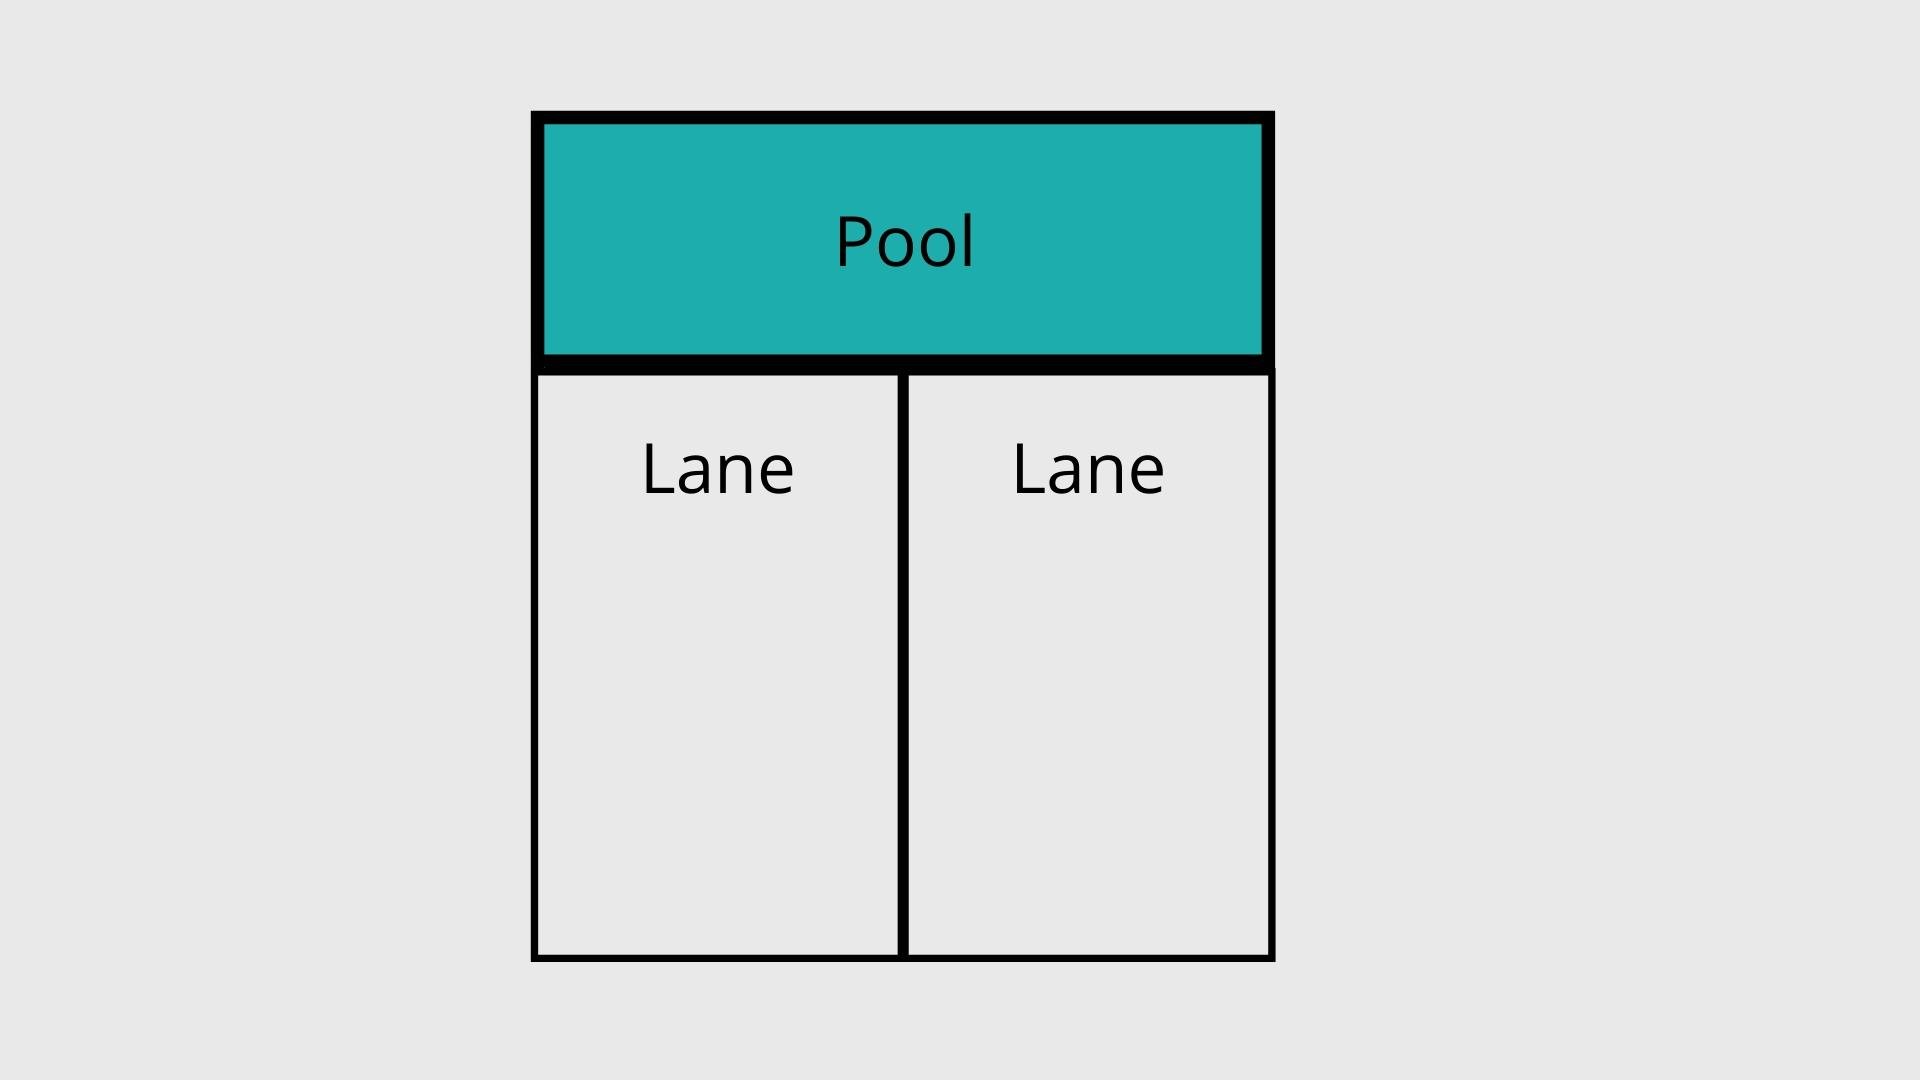
Swimlanes
- People and departments (lanes)
- sub-tasks (pools)
Artifacts
- Annotations, extra information (additional data objects)
Many business analysts prefer BPMN because it is standardized. This leaves no room for ambiguity or miscommunication.
As a result, information and knowledge can be easily communicated to other departments and stakeholders outside the company without you having to explain what is the meaning of every object.
Unified Modeling Language (UML)
The Unified Modeling Language was initially designed to visualize software systems. However, it has been adopted to serve as a business process modeling technique.
Why?
Because there are14 different UML diagram types.
This gives you a lot of flexibility, allowing you to choose the type that best fits the nature of your business processes.
You can think of UML diagrams as the object-oriented version of flowcharts. But keep in mind that if you go for UML diagrams there’s a bit of a learning curve.
And you’ll have to figure out which one of all 14 options is the best fit for your case. So it can get a bit confusing.
However, once you figure out the basic UML syntax and choose the right type of diagram, you can definitely benefit from the UML modeling technique.
The diagrams are sub-divided into 2 categories:
Structural diagrams
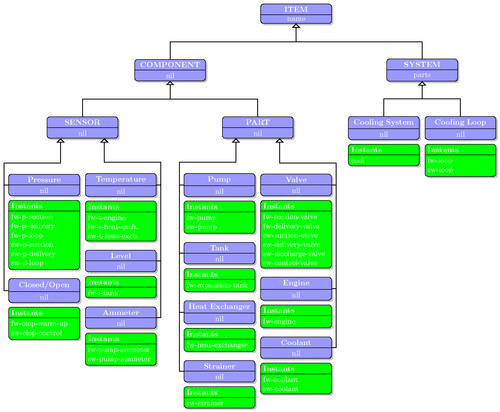
- Class Diagram. Shows the classes in a system with their attributes and the relationships between them.
- Component Diagram. Used to represent the structural relationship between different components.
- Deployment Diagram. Shows the hardware you’re using and the software used on that specific hardware.
- Object Diagram. Shows the condition of your system of objects in a specific time period.
- Package Diagram. Helps you understand the dependencies between different package systems.
- Profile Diagram. Helps you customize an already existing UML diagram.
- Composite Structure Diagram. Shows you the internal structure of a class.
Behavioral diagrams
- Use Case Diagram. Gives you an overview of different functions, the people assigned to them and how they interact with each other.
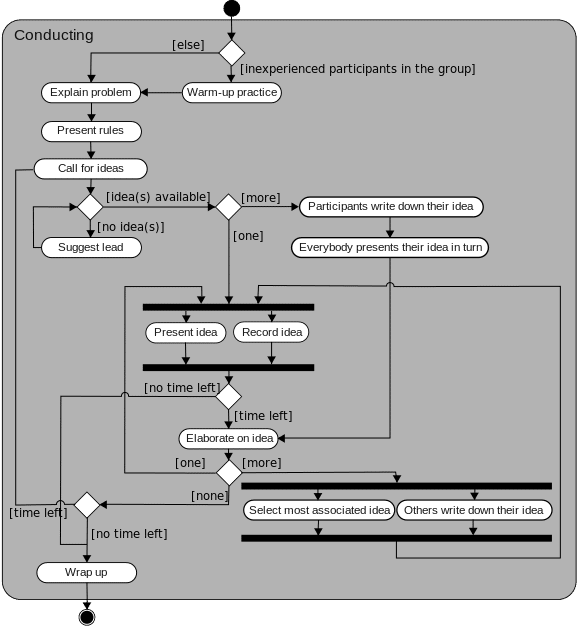
- Activity Diagram. Helps you to graph any workflow within your system.
- State Machine Diagram. Used to describe the behavior of an object depending on their state.
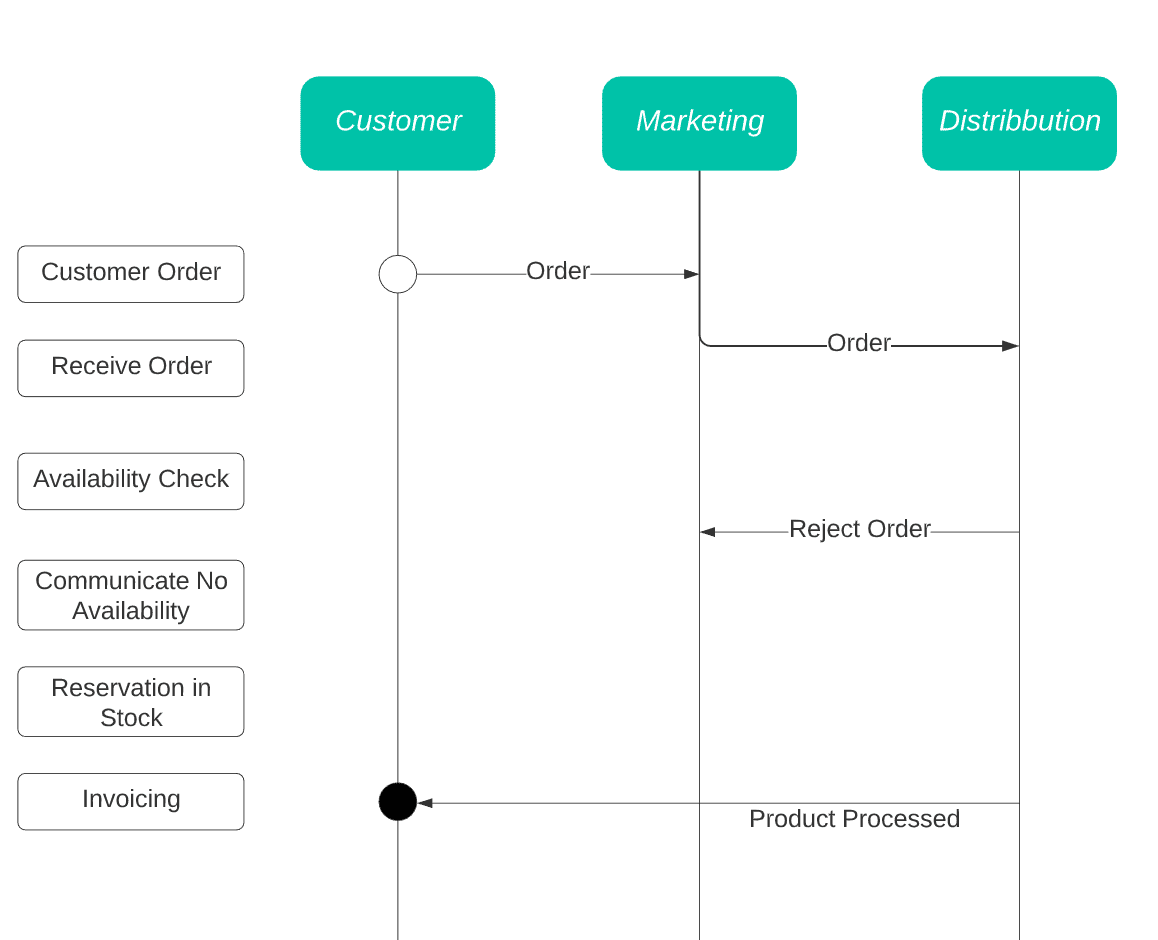
- Sequence Diagram. Represents the order of the interactions between different objects.
- Communication Diagram. Focuses on the flow of information passed between different objects.
- Interaction Overview Diagram. This is a collection of interaction diagrams and the order in which they happen.
- Timing Diagram. Shows the behavior of the objects in a specific time frame.
Flowchart Technique
Flowcharts are the most basic way of representing a business process. You can think of them as the predecessor of BPMN.
Flowcharts are diagrams that represent business processes in a visual, sequential manner, making them easier to understand and analyze.
However, this process modeling technique is not the best choice if you have a complicated process with lots of parallel activities happening simultaneously.
Flowcharts are a great way to introduce a beginner to the business process modeling concepts and are also a very useful technique to use when you want to map out a straightforward process.
Data Flow Diagrams (DFD)
Data flow diagrams are used to visualize the flow of data and information for any process, or system (generally a business information system).
They are information-oriented rather than focused on the activities themselves.
What this technique does best is showing how the data flows between the different entities within a process. So, if you want to focus on the process steps or the employees’ role in the process this method might not be a good fit.
But if your business is information-driven and data is the essence of your workflows, DTD is a good choice for a business modeling technique.
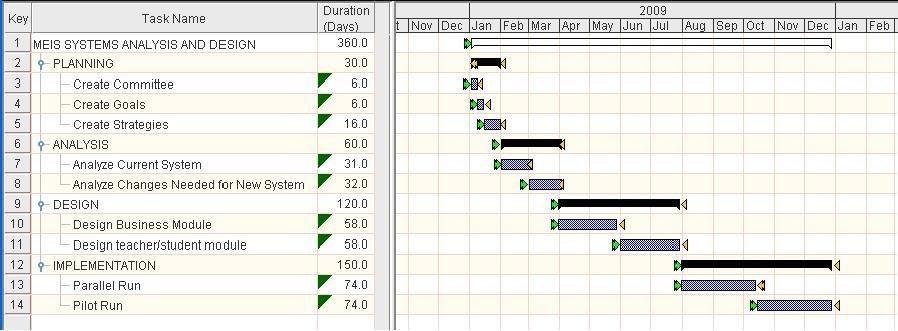
Gantt Charts
Gantt charts model business processes by placing each process step on a timeline, allowing you to see the flow of tasks with their respective deadlines and assigned resources.
In terms of process modeling, Gantt charts are quite limited due to their simplicity.
So if you are trying to model complex processes with countless substeps, spanning multiple departments and timelines, then a Gantt chart might not be the answer.
However, this modeling technique is still very useful for project management activities where scheduling tasks and keeping track of deadlines is crucial.
A well-made Gantt chart can guide employees on when exactly their assigned task should start and finish and it also helps managers monitor whether the process is moving according to schedule.
This makes Gantt charts very useful for time-dependent processes and activities that have a rigid timeframe.
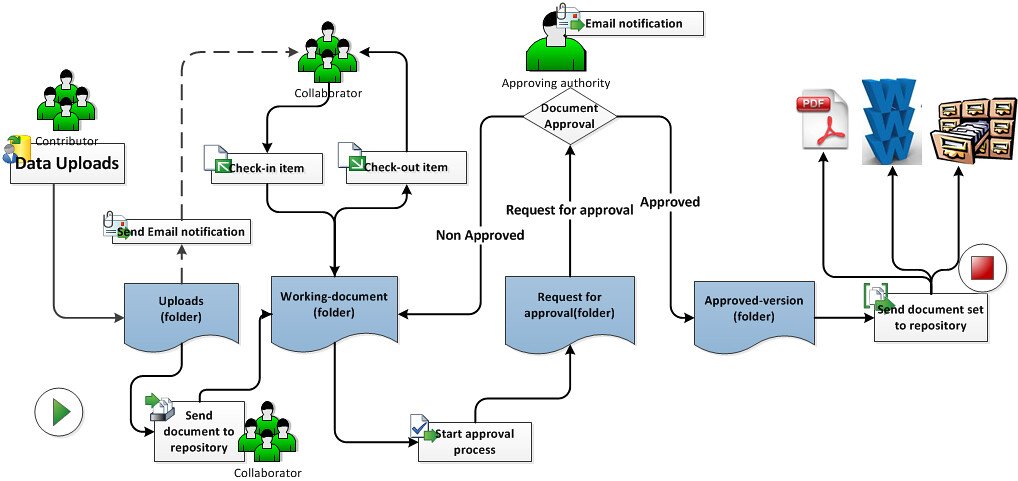
Workflow Technique
The workflow modeling technique maps out the flow of tasks between people and/or computer applications. It consists of sequential or parallel steps performed with the purpose to achieve a certain goal.
This modeling technique clearly shows who is assigned to what tasks. This way, your employees can better understand their role as part of the bigger process.
They can clearly see their responsibilities and tasks within the process and their deadlines. Ultimately, helping you to pinpoint and avoid any possible bottlenecks.
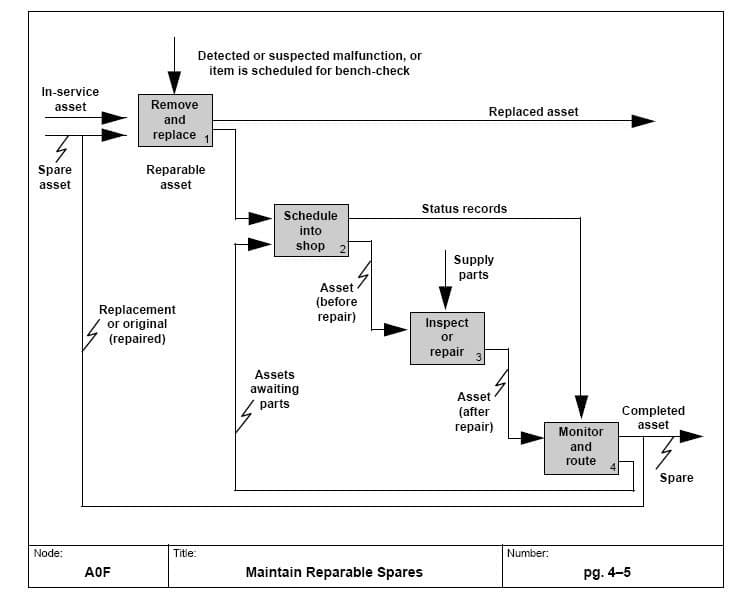
Integrated DEFinition for functioning Model (IDEF)
IDEF is a modeling technique invented by the US Air Force in the 1970s but now it is mostly used to analyze an organization’s business processes.
IDEF has 16 different modeling methods. The most useful ones for business process modeling, however, are:
- IDEF0 – Function modeling – used to describe the functions of an enterprise. This method is probably the most popular since it helps you model your processes in a detailed manner. You can capture the resources, people, the end product, and its relationship to all steps of the process.
- IDEF1 – Information modeling – represents the information you need to support the functions of a given business process.
- IDEF 3 – Process Flow and Object State Description Capture Method – this is a process description method that gives you a top-down view of your process and helps you understand what’s the best way to improve the problematic areas.
Depending on your case, you can use other IDEF methods which can help you construct a detailed model of your process targeting different areas like data, objects, information, or simulation design.
This modeling technique can certainly give you lots of insights, offering flexibility and an easy-to-read diagram structure.
Colored Petri Nets (CPN)
The Colored Petri Nets modeling technique has a very well-defined mathematical syntax behind it, so constructing it requires a certain degree of knowledge.
However, CPN allows you to color-code the different sets of tasks in the process which in turn allows for great visual representation.
This is particularly useful if you have a process or a system with many parallel and sequential steps that require continuous communication, synchronization, and resource-sharing.
In this sense, CPN is a good alternative to the flowcharts modeling technique which doesn’t allow for simultaneous task representation.
Role-Activity Diagrams (RAD)
The Role Activity Diagram modeling technique shows the roles of employees, suppliers, and customers and their assigned tasks/activities.
This is useful when you want to focus on the organizational functions and how they affect each other.
RAD is easy to read and understand. It is a great technique to use when you want to concentrate on the activity dependence between the different actors and their interactions.
Role-Interaction Diagrams (RID)
The Role Interaction Diagram technique visualizes the different roles/entities on the top horizontal axis assigned to the respective activities on the left vertical axis.
This way, you can see which person/department does what and when the interaction takes place.
RID is very straightforward but some confusion might arise from the high number of interaction arrows going back and forth in more complex processes.
This is a good technique to use if you want to focus on the flow of interactions but keep in mind that this technique doesn’t let you model the inputs and outputs of the process.
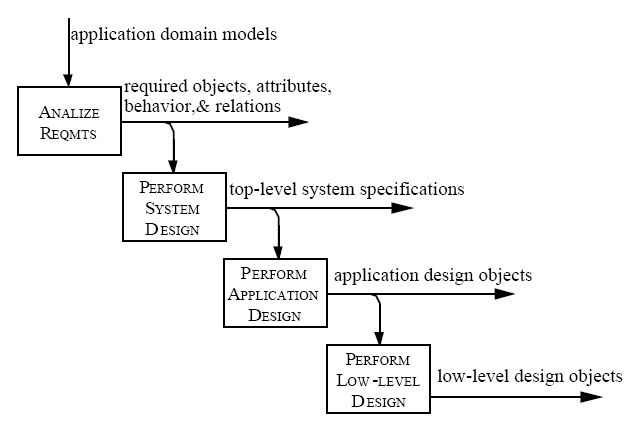
Object-Oriented Methods
The Object-oriented method helps you visualize a process through the description of its objects or so-called entities. Each object has 3 components:
- State
- Behavior
- Messages
The entity is in a defined state which has a defined behavior. To get the entity from one state to another, you guide its behavior by sending messages (or instructions).
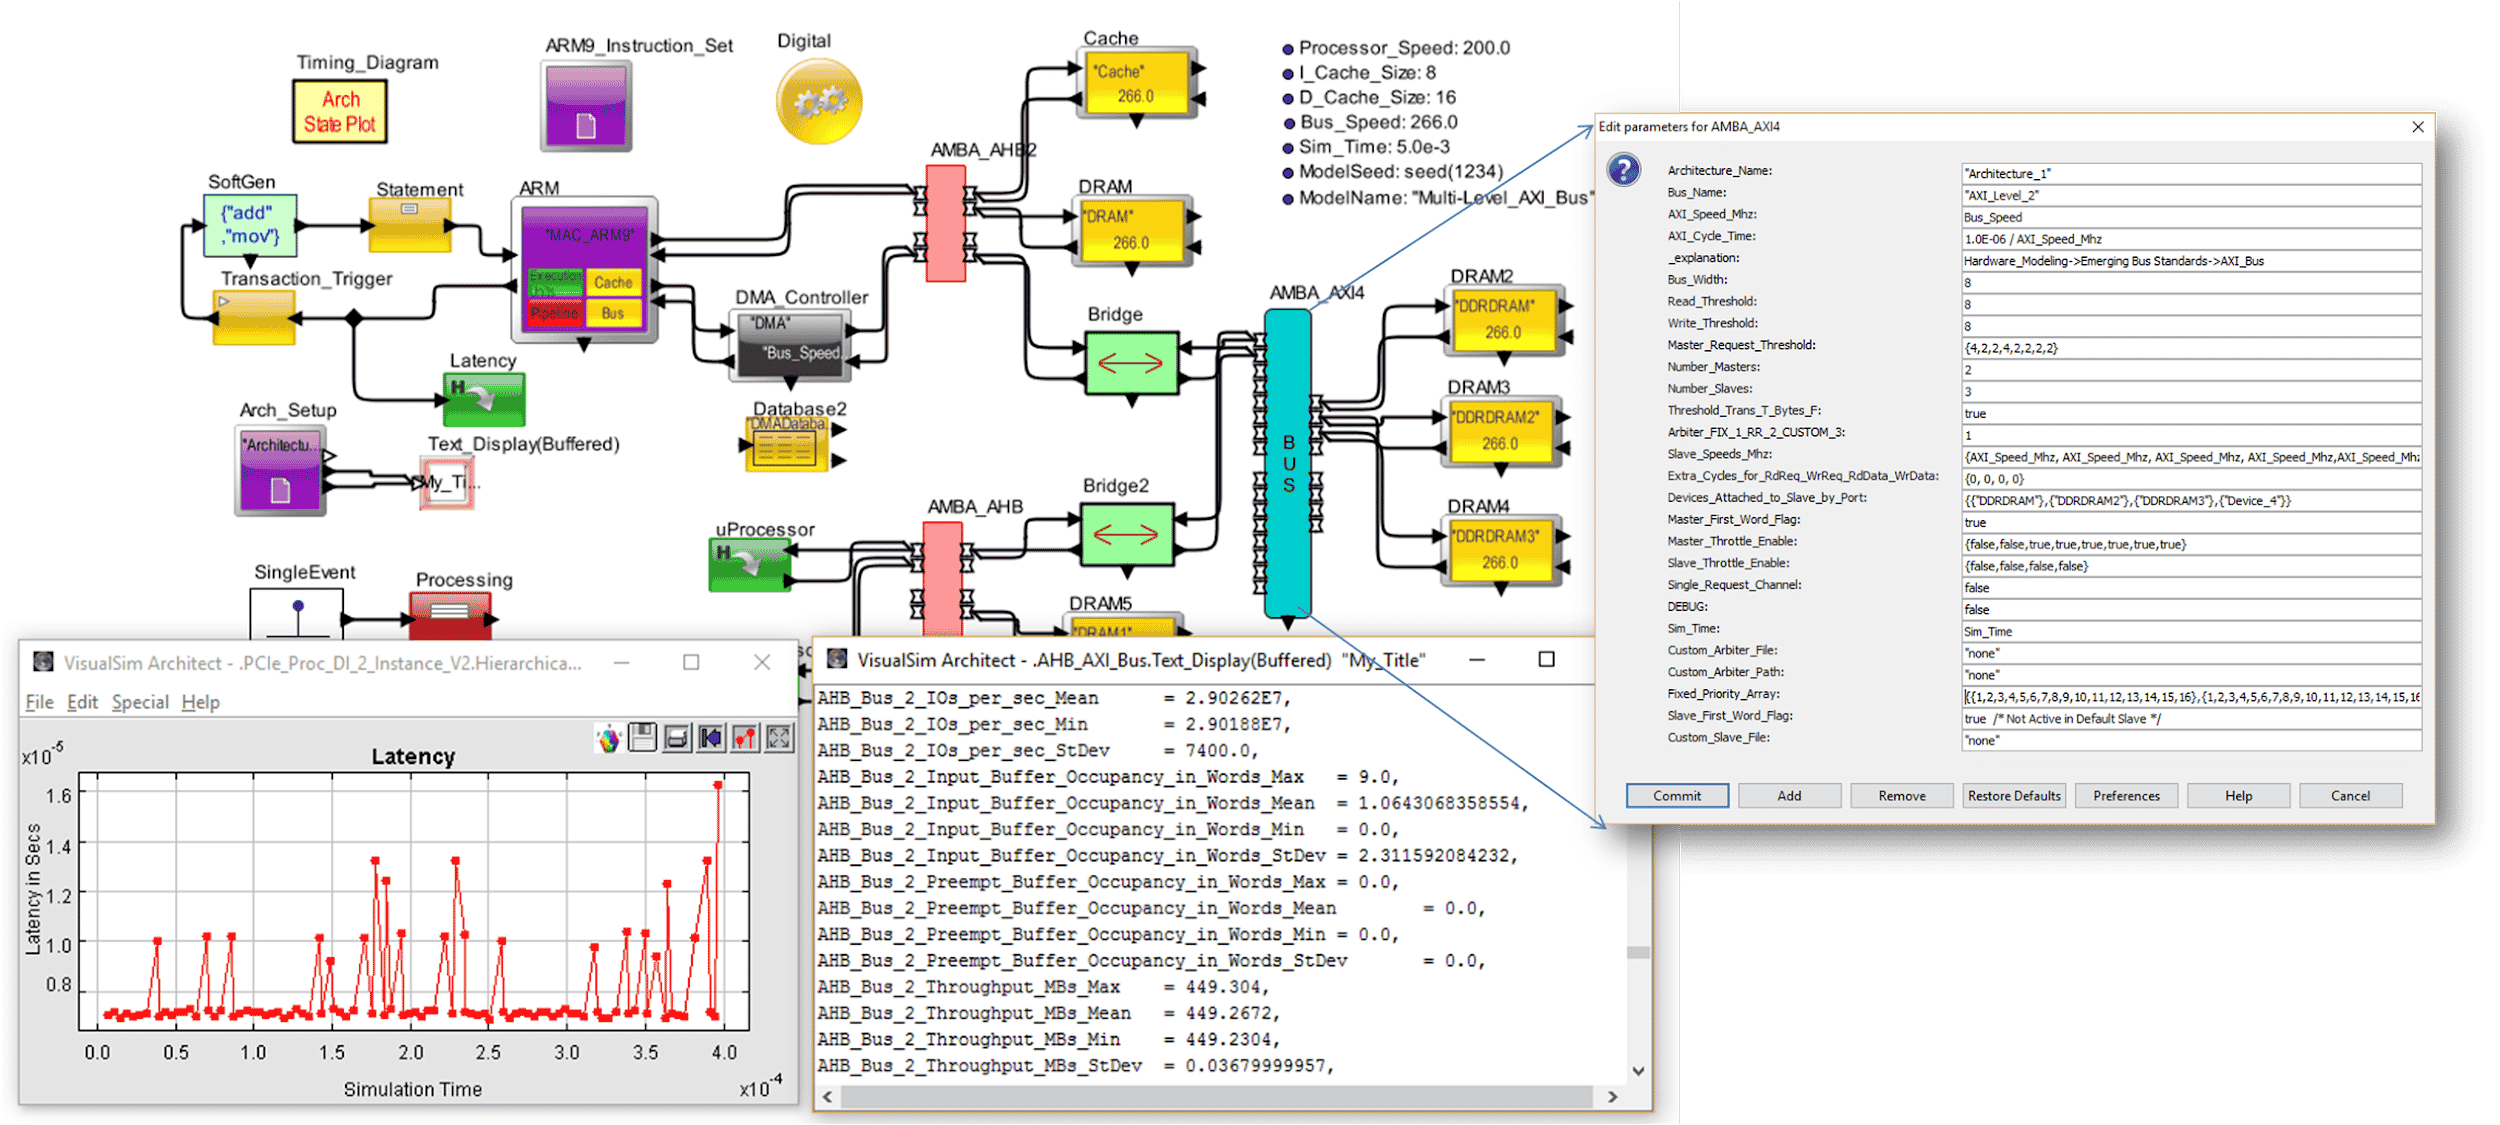
Usually, the object receives a message to carry out a task and report back to the sender. The changed object state and progress are documented and this goes on until the process is completed.
Simulation Model
The simulation model technique is very useful when you want to study a real-life model that is too complex.
When using simulation models you can observe, analyze, and predict outcomes so you can make an educated decision about a real-life business question you’re facing.
Depending on your business process and the specific challenges/objectives you can use different simulation models like:
- Discrete event simulation
- Risk analysis simulation
- Agent-based modeling and simulation
- System dynamics
Conclusion
As you can see, there are many business process modeling techniques out there and you just have to make an informed choice on which one is the best for your business and your particular problem.
For example, Gantt charts do little to model a detailed representation of a process but they are a great tool for tracking time-sensitive processes.
And flowcharts don’t offer many advanced options but they let you get a quick overview of fairly simple processes.
So there are modeling techniques that suit different needs and after reviewing the 12 most popular ones you should be able to choose which is the right one for you.
We hope you enjoyed this article and if you want to learn more about process management, follow our blog!


