Workflow diagrams are flowcharts that graphically explain the relationship between different people, tasks, and resources in a process. They make even the most complicated business processes easier to understand.
Workflow diagrams are particularly useful for managing your workflows – once you have a visual workflow in front of you, it’s super easy to spot inefficiencies and find improvements within your processes.
In this guide, we’re going to teach you all you need to know about workflow diagrams, including:
- What is a workflow diagram and why is it useful?
- How to create a workflow diagram using 6 simple steps
- Real-life examples of workflow diagrams
- Basics of workflow management (what it is, how to do it, and why)
Let’s dig into it!
What is a Workflow Diagram?
A workflow diagram is a visual representation of a company’s processes that uses standardized shapes to explain the relationship between different elements of the process.
In simple terms, workflow diagrams visualize the flow of work within an organization. This makes the company processes more transparent and easier to understand.
But before we dive deeper into workflow diagrams, let’s talk about the basics.
In order to get a hang of workflow diagrams, you need to first understand what is a workflow.
For example, let’s take a simple vacation approval process:
- The employee fills out the approval form
- Manager reviews the document
- If the employee has enough PTO accrued – proceed to substep b
- If the employee gave a long enough notice – proceed to the next step
- If something is wrong – send back the form for revision
- Manager approves the form and sends a confirmation to the employee
Workflow diagrams, on the other hand, are visual representations of these workflows.
Workflow diagrams can take different forms, but usually, they are represented with a process flowchart. Here’s how the workflow we just described would look like as a workflow diagram:
In the example above, shapes and colors have a specific meaning. For instance, yellow rectangles represent tasks to be completed by a manager and rhombus represents a decision point.
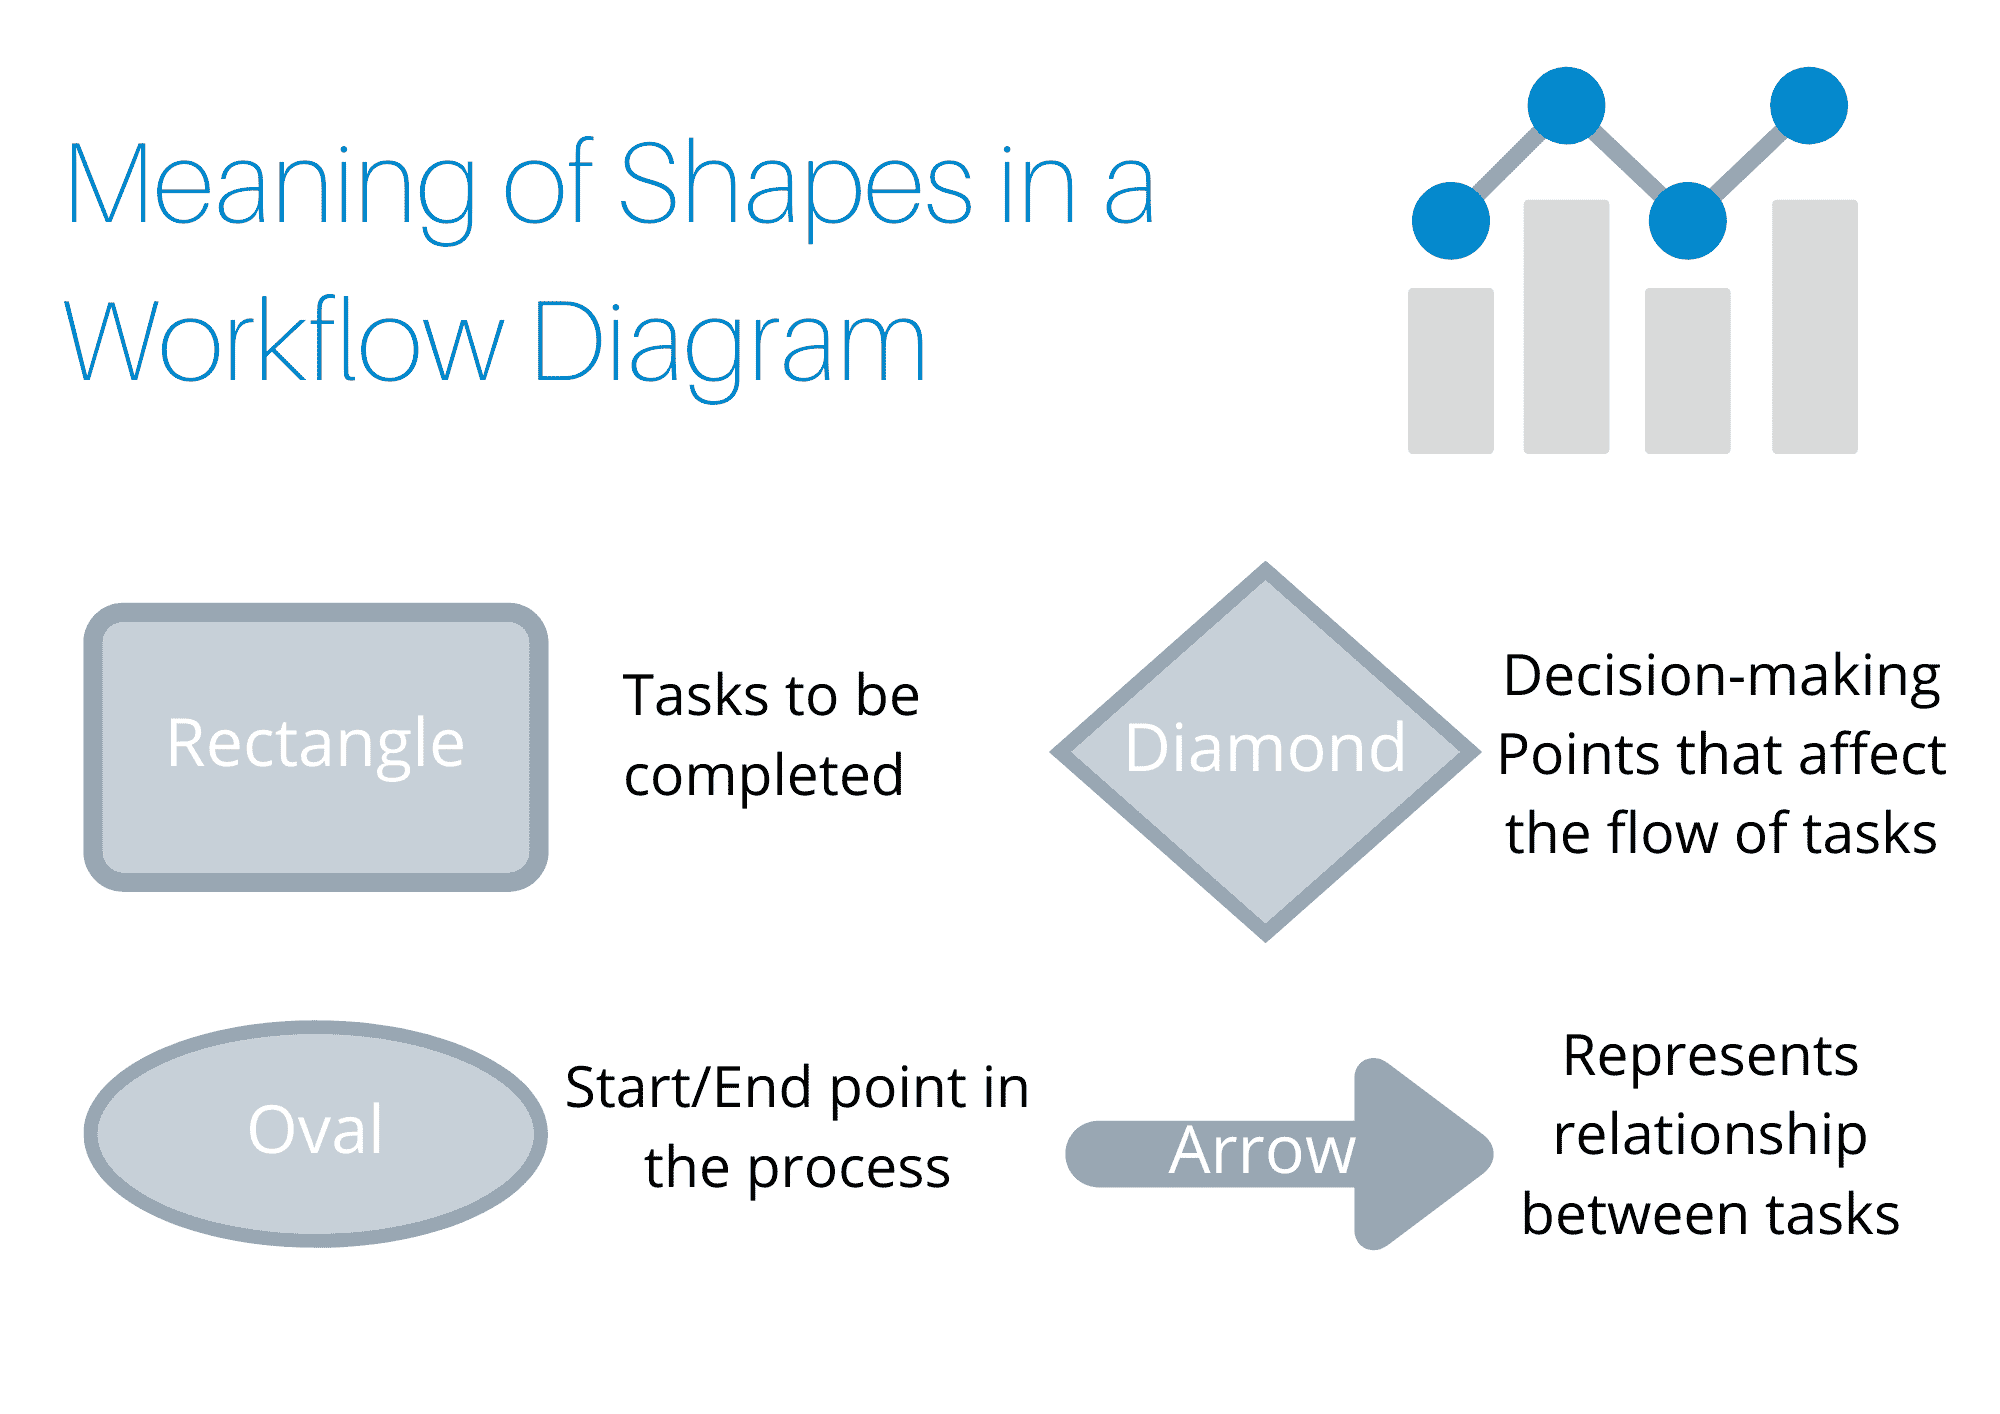
Depending on the complexity of your business processes, you can assign different meanings to the shapes and colors in a diagram. However, the most commonly used flowchart elements are the following:
- Rectangle – tasks to be completed
- Diamond – critical points, where decisions have to be made
- Oval – start/endpoints in a process
- Arrow – relationships between different tasks within a process
Or represented visually…
If the processes you are trying to analyze are more complex, then your workflow diagram will also use other shapes to represent the different components of that process (such as a cylinder for a database).
Nonetheless, the elements above should be enough for you to build workflow diagrams for most of your basic processes.
Benefits of Using Workflow Diagrams
Workflow diagrams serve 4 distinct purposes:
- Process analysis. Visually represented processes allow you to see the bigger picture. This makes it easier to analyze your processes and find bottlenecks or inefficiencies.
- Process improvement. Once you identify process inefficiencies using diagrams, you can come up with a plan to improve certain parts of your workflow.
- A clear flow of information. Workflow diagrams make it easier to understand who is responsible for what task/step in the process. This can drastically improve communication organization-wide.
- Storing knowledge. Workflow diagrams also act as a tool for storing employee knowledge. For example, if an employee forgets a certain step for a specific process, all they have to do is look up the relevant workflow diagram.
Now that you have a clear understanding of what workflow diagrams are and how they can improve your business, it is time to introduce you to the most popular workflow examples.
3+ Practical Workflow Diagram Examples
Remember: you can illustrate ANY process using workflow diagrams.
Recruitment Process
An average-sized American company receives 250 applications on a daily basis. This makes the recruitment process one of the most common workflows for any organization. Using workflow diagrams to illustrate this process will help your HR department to get this process right.
Employee recruitment usually goes like this:
- Someone from HR submits a job posting
- Potential employees submit their applications for the position
- If there are enough eligible candidates – proceed to the next step
- Otherwise – resubmit the job posting or find a different job board
- Shortlisted candidates are selected and invited for an interview by HR or a team lead
- Same people conduct interviews with potential employees
- Team lead selects the best fitting employee
- Department leader signs the hiring paper
- Transferring employee to onboarding workflow
Here’s how that looks like, as a workflow diagram:
Employee Onboarding Process
Another typical process for every organization is employee onboarding.
According to research conducted by Digitate, an employee is 2x more likely to leave a company given poor onboarding experience.
Therefore, it is important to get this process right.
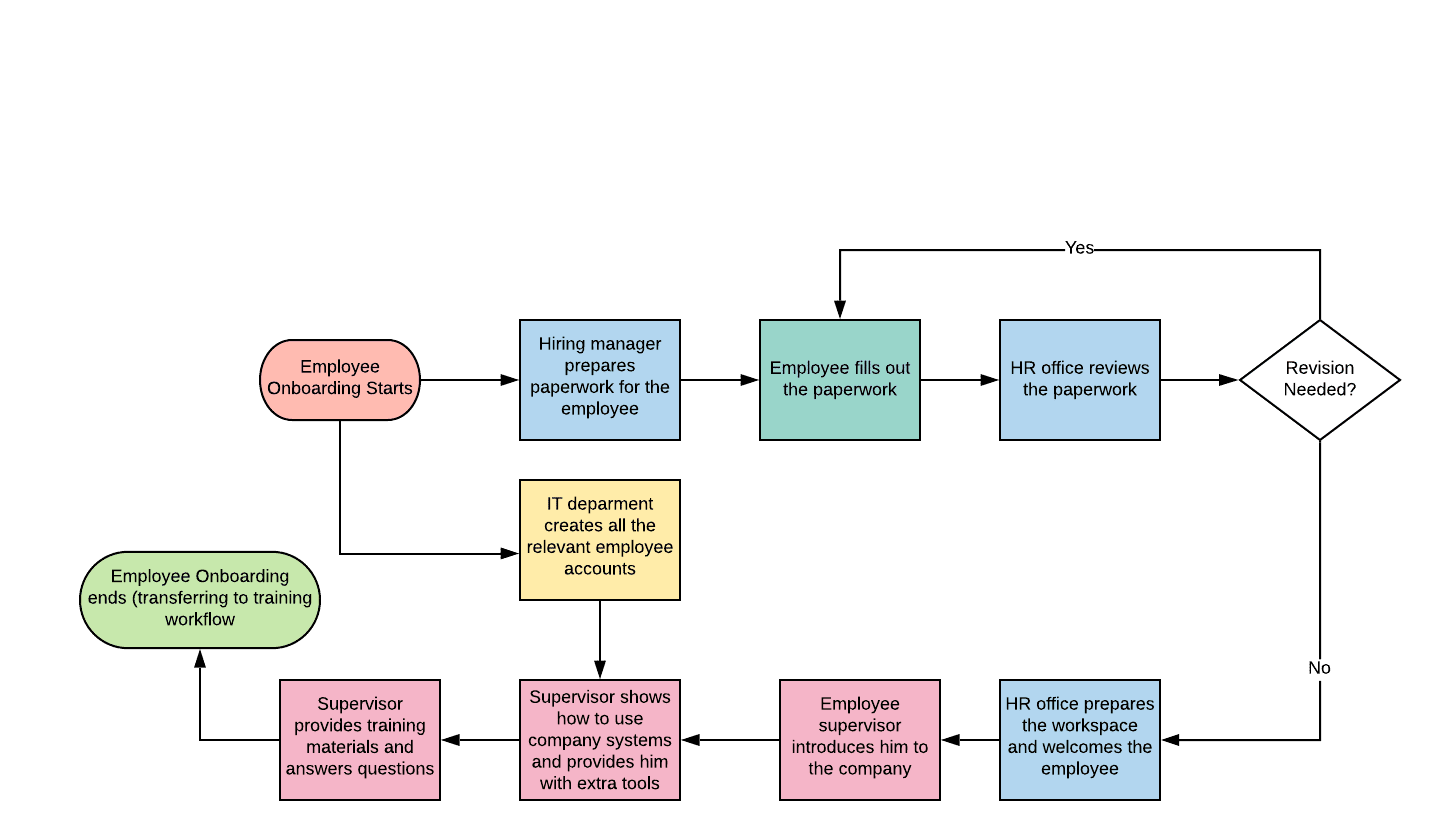
Here’s how a typical employee onboarding process goes:
- The HR manager notifies the team about the new hiree and gathers paperwork
- The employee fills in the paperwork
- HR office reviews the paperwork
- If papers are good – proceed to the next step
- Otherwise – request revision
- HR representative or supervisor sets up the workspace and welcomes the employee
- Tour around the company
- A supervisor reviews programs and provides tools (wi-fi password, water cooler routines briefing)
- IT office creates relevant accounts and adds the employee to the database
- Employee supervisor briefs him through the systems and goes over the training material with the employee
- Supervisors checks if there are any questions and transfers employee to training workflow
Or represented as a workflow diagram…
Client Onboarding Process
On the other hand, client onboarding is also a very important process, as it determines the first impression that you leave with your client. A proper client onboarding process can increase the chances that a customer will stick with your business by 86%.
Here’s how it usually goes:
- A workflow starts once the client submits a contact form
- The data is then sent to a Google sheet or internal database
- You assign one of your sales guys to have a meeting with the client
- Your team then identifies project specifications and deliverables
- Once the project brief is ready, it is sent to the client:
- If approved – move to the next step
- If adjustment is requested – get back to step 4
- If the approval gets rejected and you lose your customer – cancel workflow
- The customer signs up in your platform and submits personal information
- You sign a contract with the client and assign an account manager
- Account manager gathers all the relevant documents
- Transfer to project execution workflow
Or represented as a workflow diagram:
As you can see from the diagrams above, any process is easier to comprehend once it is represented by a workflow diagram.
Now that you are familiar with all the technicalities, it’s time to put your knowledge to good use and learn how to create an effective workflow diagram yourself in 6 simple steps.
How to Make a Workflow Diagram – 6 Easy Steps
Step #1: Decide Which Diagram Tools You’re Going to Use
First, you need to decide how you are going to create a workflow diagram. There are 2 best ways to do it.
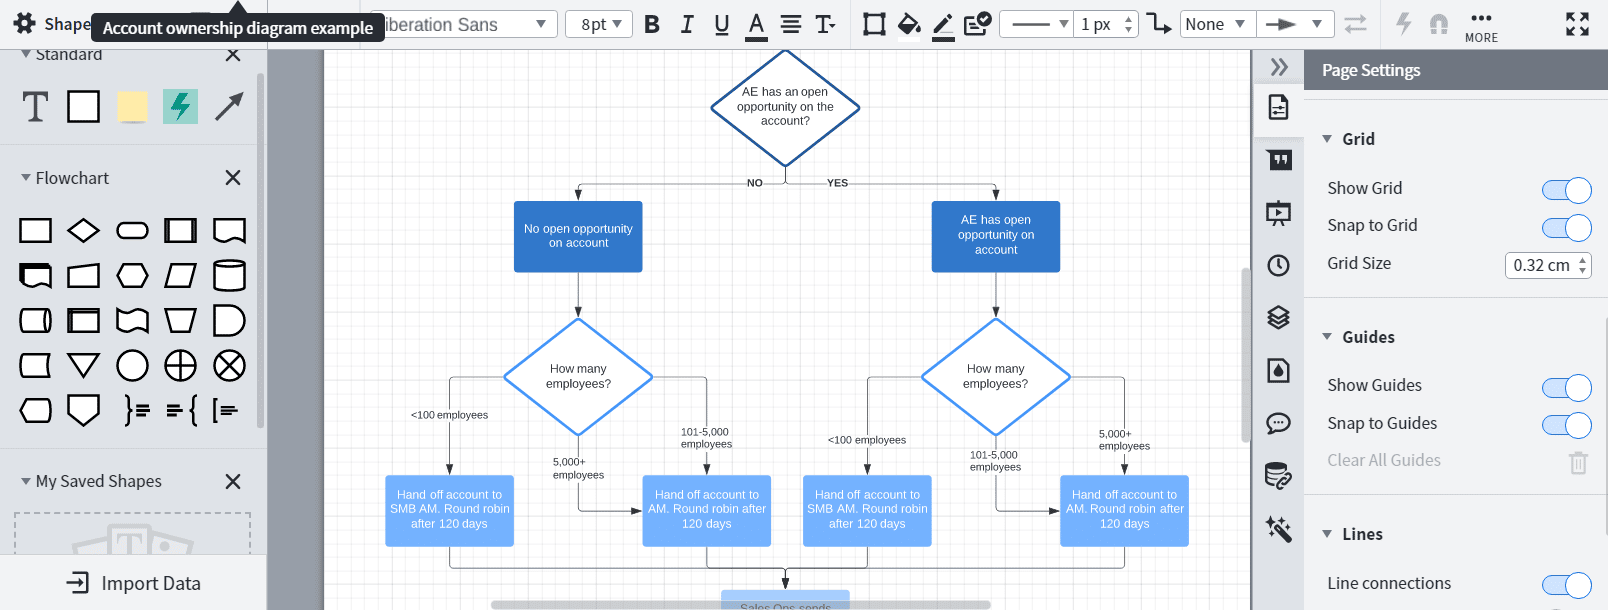
First, you can use graphing software like Lucidchart to create workflow diagrams.
Creating a workflow diagram with Lucidchart is as simple as dragging and dropping a bunch of shapes and connecting them together.
The best part about Lucidchart is that it comes with 1000+ pre-built process templates, which you can modify.
The software is super simple, but effective.
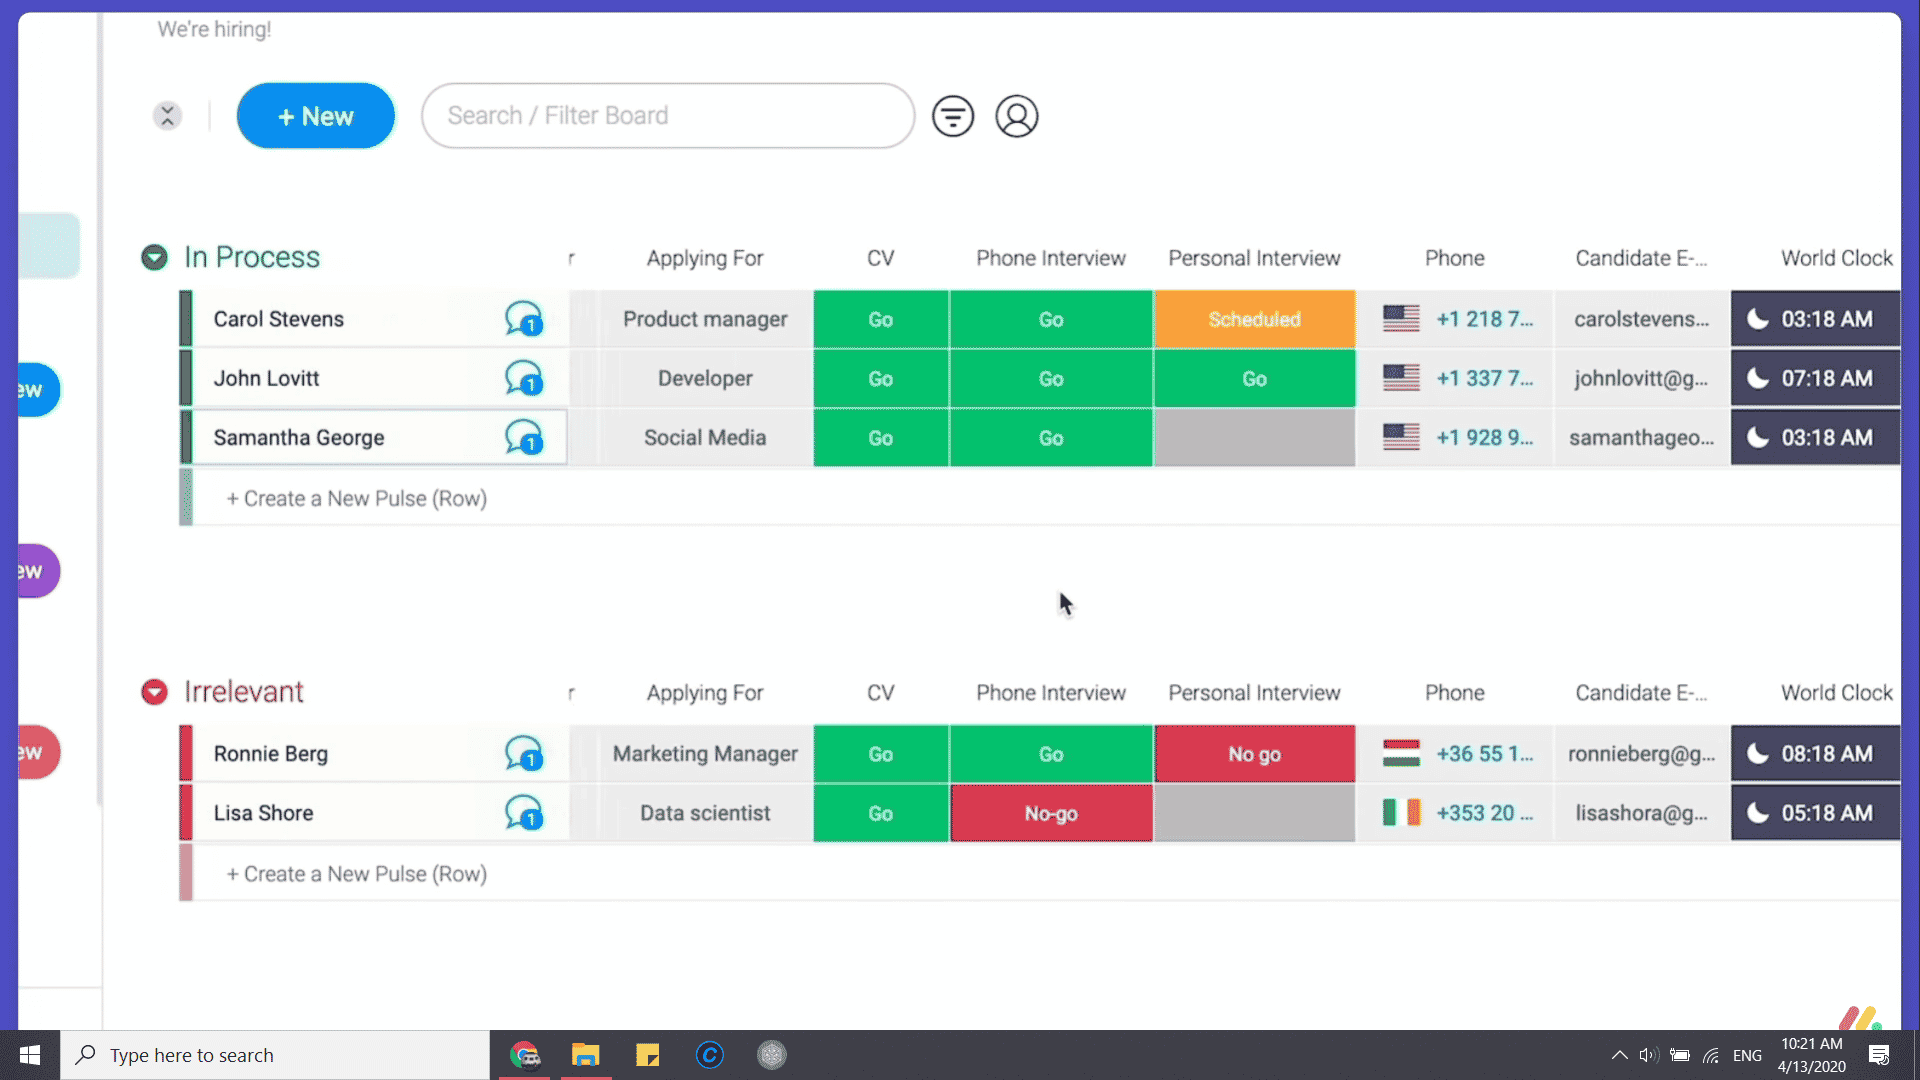
If you’re looking for a more advanced solution, though, you should try workflow software like monday.com. Workflow software allows you to create digital versions of your workflows, automate specific parts of it, and overall make it significantly easier to manage your processes.
The best part about monday.com is that you can program this software to execute repetitive tasks, saving your employees time. The automation possibilities are endless: you can generate invoices, send reminders, schedule meetings, or get signatures automatically.
Step #2: Pick the Process
For the next step, you need to clearly define the process you want to work on.
We generally recommend starting with:
- Processes that have a high impact on the end-product
- Processes that are underperforming
- Processes that are wasting too many resources
Step #3: Map the Process
Mapping processes might look easy on the surface, but to ensure that you get it right, you need to collect a lot of extra information.
You have to talk to the right experts and answer the following questions:
- What are the start and endpoints of the process?
- Who is responsible for what tasks within the process?
- What are the connections between different steps in the process and how are tasks delivered?
- What is the timeline of the process?
- Are there any bottlenecks or bad use of resources at any point?
- Are there any possible deviations from the plan?
- Can we plan ahead for contingencies?
Step #4: Create As-Is Workflow Diagram
At this stage, you should have all the information you need to create your workflow diagram.
The “how” here is pretty straightforward – just use one of the tools you picked at the beginning, and draw your workflow diagram.
You can also use a workflow diagram template. Both paid tools like Lucidchart and free tools like draw.io have predesigned templates that can get you up and running in less than 5 minutes.
Keep in mind though, that creating the diagram is not the end of the process. After that, you need to conduct a workflow analysis to find ways for eliminating redundancies and inefficiencies.
Which takes us to the next step – workflow analysis.
Step #5: Analysis and Improvement
If you want to get the most out of your workflows, you need to constantly analyse and improve them.
Once you have your workflow diagram, you might have already figured out a potential improvement or two. So, at this stage, you can really think the process through and define the exact improvements you can implement.
You can find potential improvements by asking the following questions:
- How can we address existing bottlenecks and resource inefficiencies?
- Is there potential in automating parts of the process?
- Are there any obsolete/redundant steps in the process?
- Could we use more efficient software or hardware combinations?
- How can we employ our resources to maximum potential?
- How can we reduce operational risks?
Once you’re done with this, you can start categorizing the different tasks within the process into the following:
- Vital – Tasks that are essential for the workflow (keep as-is)
- Useful – Tasks that contribute to the workflow (keep as-is)
- Nice but not necessary – Tasks that could potentially be automated or removed in future iterations (to be improved/automated/removed)
- Eliminate – Tasks that are either redundant or inefficient (remove)
Step #6: Create a To-Be Workflow Diagram
Once you’ve come up with potential process improvements, before implementing them, you should document them into a to-be workflow diagram.
What this means is, you create a similar diagram to the one you made in Step #4, but with the improvements implemented.
This makes improvement-implementation significantly easier, since all you have to do to communicate changes is give this new diagram to your employees.
Workflow Diagram Types
There are a variety of different workflow diagram types you can use to display a workflow diagram. Here are the 5 most common diagram types:
- UML Activity Diagram – UML stands for Unified Modeling Language. UML diagrams are mainly used in programming to graphically represent the steps in a process, the order in which they are executed, and the different control flows.
- BPMN – It stands for Business Process Model and Notation and it is one of the most commonly used diagram types for visualizing internal business processes. The main use for BPMN is to clearly communicate internal procedures to both technical and business users.
- ANSI Flowcharts – The American National Standard Institute flowchart notations are the first standardized workflow diagram notations ever made, and are also the most commonly used ones.
- SIPOC – SIPOC stands for Supplier-Input-Process-Output-Customer and this type of diagram is used to map a business process, including all actors, actions, and flow of information, from a high-level view.
- Swimlane Diagram – Swimlane diagrams are used to delineate who does what in a process. By using the swimlane metaphor, this type of workflow diagram allows you to map actions within a process to specific entities or departments. This way you can get a clear picture of which departments are responsible for which parts of the process.
Workflow Management 101
More often than not, workflow diagrams are used in the context of workflow management.
Workflow management, in essence, is a methodology for constantly mapping, analyzing, and improving company workflows.
As such, we thought it might be useful to give you a general idea of how workflow diagrams relate to other important buzzwords within the niche…
Workflow management. As we just explained, workflow management is what you’re doing if you’re constantly working on maximizing your process efficiency.
Workflow management software. If your business is serious about workflow management, it’s essential to use the right workflow software. The software puts ALL your workflows in one place, allowing you to manage them through a single dashboard.
Workflow automation. When using workflow management software, you can automate specific tasks. E.g. sending an email, moving an entry from one database to another, etc.
Conclusion
Thank you for reading this article!
We hope that it helped you understand what a workflow diagram is and how it can help you analyze your processes better. If you would like to learn more about workflow automation and other relevant business topics, make sure to follow our blog.
Until the next time!


